We offer many ready-to-use apps, among them a serial-over-IP (SoI) app and Modbus Gateway app.


Tibbo > Linux Ecosystem > Node.JS API > Environmental Monitoring with LTPS, Azure, and PowerBI
This tutorial shows how to collect the environmental data — humidity, ambient pressure, temperature, and ambient lighting level — from multiple LTPS devices using Azure IoT Hub, process this data with Azure Stream Analytics, and visualize it in real time with Power BI.
First, do this:
# Create a folder for the application
cd /opt/node-apps/
mkdir environment
cd environment

# Install the required modules
npm install @tibbo-tps/tibbit-28
npm install @tibbo-tps/tibbit-30
npm install @tibbo-tps/tibbit-35
Create azure-app-0.js file with your application:
var tibbit28 = require("@tibbo-tps/tibbit-28").init("S11");
var tibbit35 = require("@tibbo-tps/tibbit-35").init("S13");
var tibbit30 = require("@tibbo-tps/tibbit-30").init("S15");

setInterval(function(){
    var illuminationData = tibbit28.getData();
    var humidityData = tibbit30.getData();
    var pressureData = tibbit35.getData();
    var dateTime = new Date();

    console.log("Date/Time: "+dateTime);
    console.log("Illumination: "+illuminationData.illumination);
    console.log("Humidity: "+humidityData.humidity);
    console.log("Temperature: "+humidityData.temperature);
    console.log("Pressure: "+pressureData.pressure);
},1000);
Upload it to the /environment folder and run:
$ node azure-app-0.js

Date/Time: Tue Jul 19 2016 13:50:54 GMT+0000 (UTC)
Illumination: 115
Humidity: 43.755340576171875
Temperature: 28.05670928955078
Pressure: 738.7398681640625
Azure IoT Hub is a service that allows bi-directional communications between your devices and a "solution back end." To continue with the tutorial, create an IoT hub.
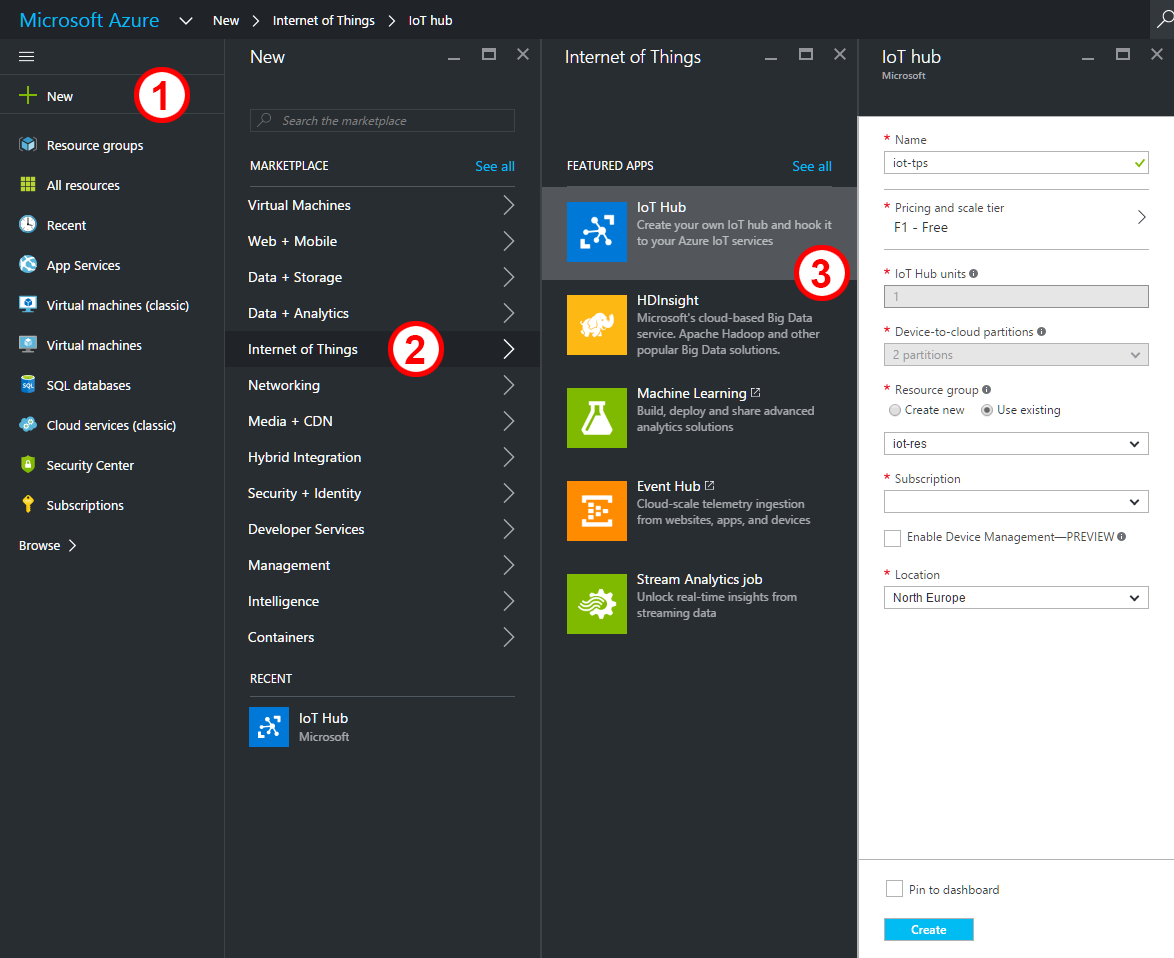
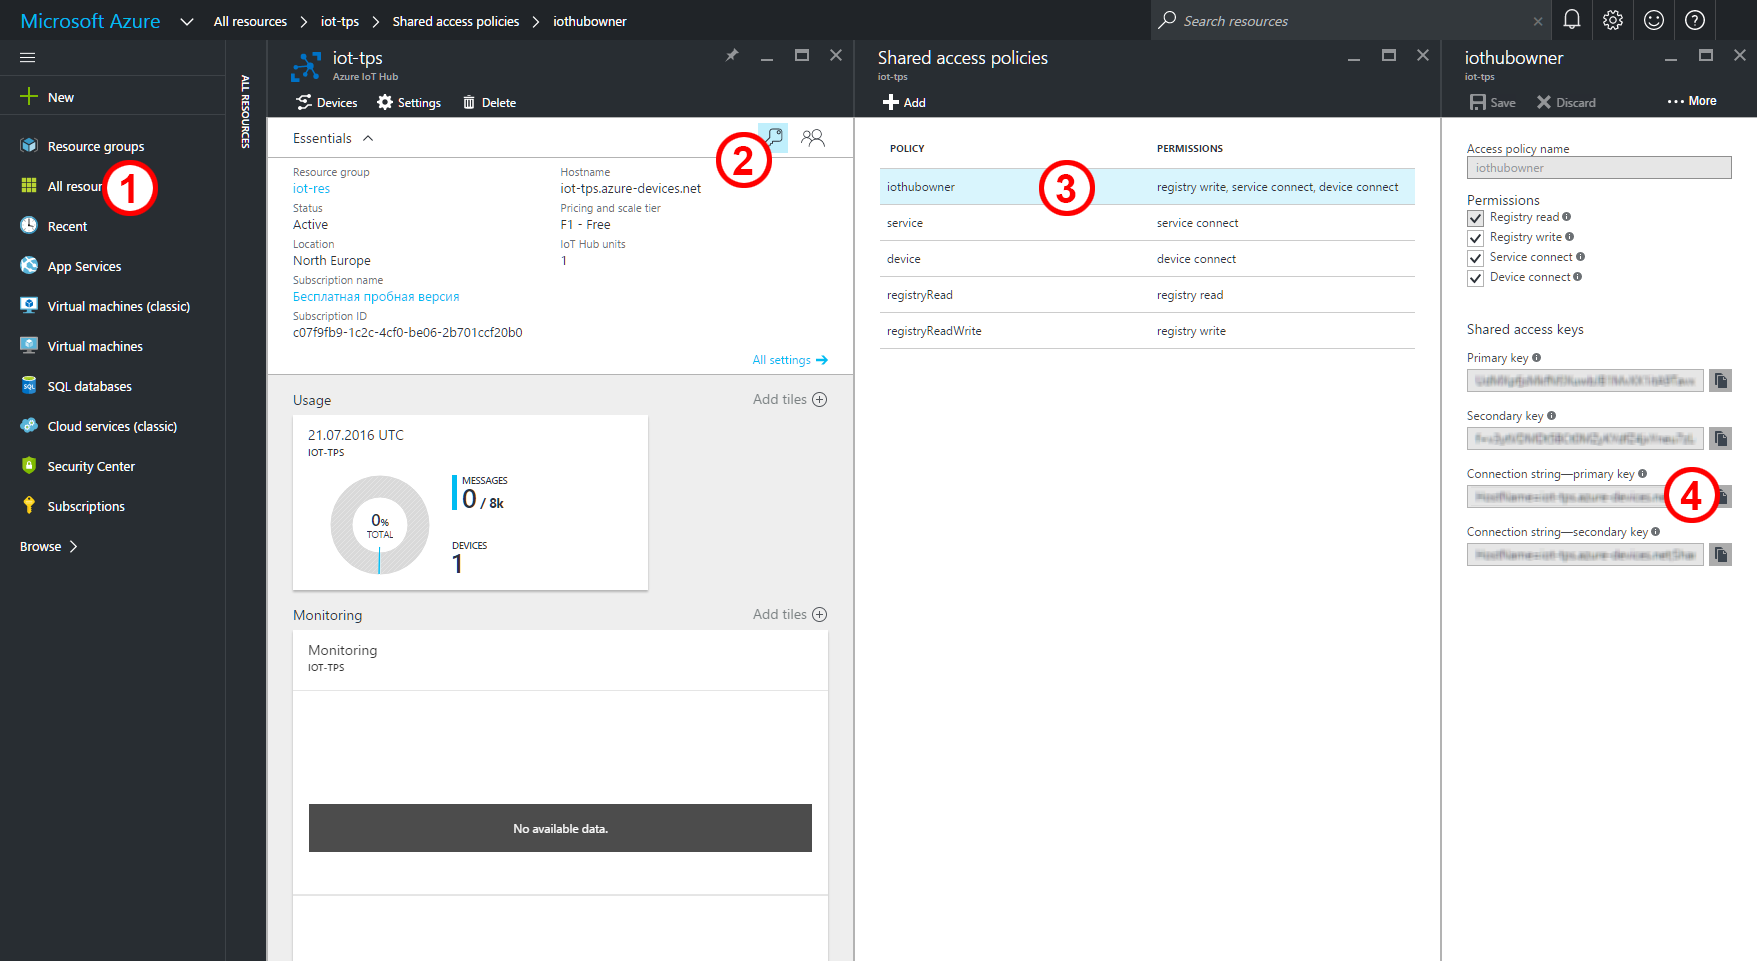
There are three ways to register device identities: with a script using Azure API, with GUI App (Windows only), and with a multiplatform CLI tool. The third way seems to be the most convenient one.
Note: To use iothub-explorer you will need Node.js V4.x or higher installed on your PC
npm install -g iothub-explorer@latest
$ iothub-explorer login <iothubowner-connection-string>

Session started, expires on Thu Jul 21 2016 13:22:10 GMT+0400
where <iothubowner-connection-string> is an iothubowner connection string from the previous step.
Replace <device-name> with the actual name of your LPTS, for example, "tps-centreville"
$ iothub-explorer create <device-name> --connection-string

Created device tps-centreville

...

connectionString: HostName=iot-tps.azure-devices.net;DeviceId=tps-centreville;SharedAccessKey=fSCVQIY..TOprSsDE=
npm install azure-iot-device
npm install azure-iot-device-amqp
var clientFromConnectionString = require('azure-iot-device-amqp').clientFromConnectionString;
var Message = require('azure-iot-device').Message;

var connectionString = '<THE DEVICE CONNECTION STRING FROM THE PREVIOUS STEP>';
var client = clientFromConnectionString(connectionString);

var tibbit28 = require("@tibbo-tps/tibbit-28").init("S11");
var tibbit35 = require("@tibbo-tps/tibbit-35").init("S13");
var tibbit30 = require("@tibbo-tps/tibbit-30").init("S15");

client.open(function(err){
    if(err){
        console.log('Could not connect: ' + err);
    }else{
        console.log('Client connected');

        setInterval(function(){
            var illuminationData = tibbit28.getData();
            var humidityData = tibbit30.getData();
            var pressureData = tibbit35.getData();

            var time = new Date().toISOString();

            var data = JSON.stringify({
                deviceId: 'tps-centreville',
                humidity: humidityData.humidity,
                temperature: humidityData.temperature,
                pressure: pressureData.pressure,
                illumination: illuminationData.illumination,
                time: time
            });

            var message = new Message(data);

            client.sendEvent(message, function (err) {
                if(err){
                    console.log(err.toString());
                }else{
                    console.log("Message sent: " + message.getData());
                }
            });
        },60000)
    }
});
$ node azure-app-1.js

Client connected
Message sent: {"deviceId":"tps-centreville","humidity":37.1016960144043,"temperature":31.370407104492188,"pressure":742.8632202148438,"illumination":136,"time":"2016-07-21T10:19:07.490Z"}
Message sent: {"deviceId":"tps-centreville","humidity":37.1016960144043,"temperature":31.370407104492188,"pressure":743.2034301757812,"illumination":137,"time":"2016-07-21T10:20:10.582Z"}
Message sent: {"deviceId":"tps-centreville","humidity":37.1016960144043,"temperature":31.380477905273438,"pressure":743.2034301757812,"illumination":138,"time":"2016-07-21T10:21:12.003Z"}
The most impressive and useful debugging feature offered by iothub-explorer is event monitoring.
With iot-explorer you can monitor events sent by your devices to the cloud and from the cloud to the devices.
This command requires you to provide the iothubowner connection string even if you're already logged in.
$ iothub-explorer <iothubowner-connection-string> monitor-events tps-centreville

Monitoring events from device tps-centreville

Event received:
{ deviceId: 'tps-centreville',
  humidity: 37.1016960144043,
  temperature: 31.380477905273438,
  pressure: 743.2034301757812,
  illumination: 138,
  time: '2016-07-21T10:21:12.003Z' }
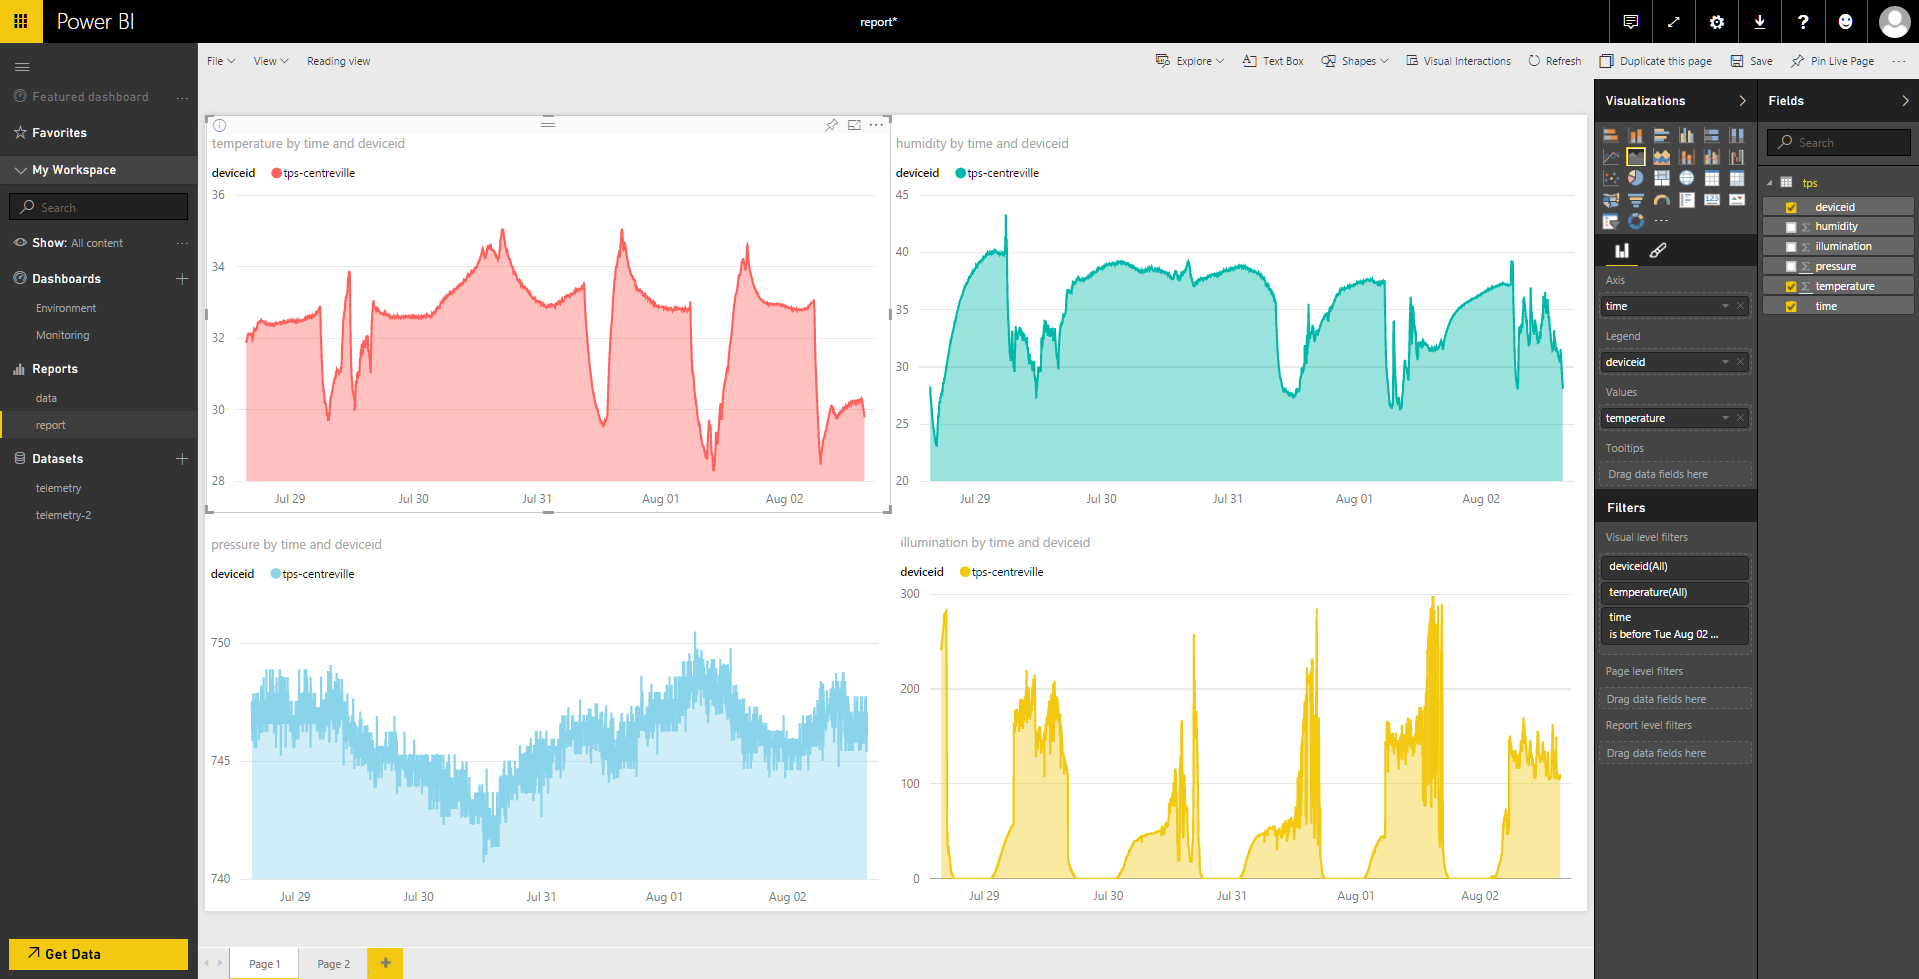
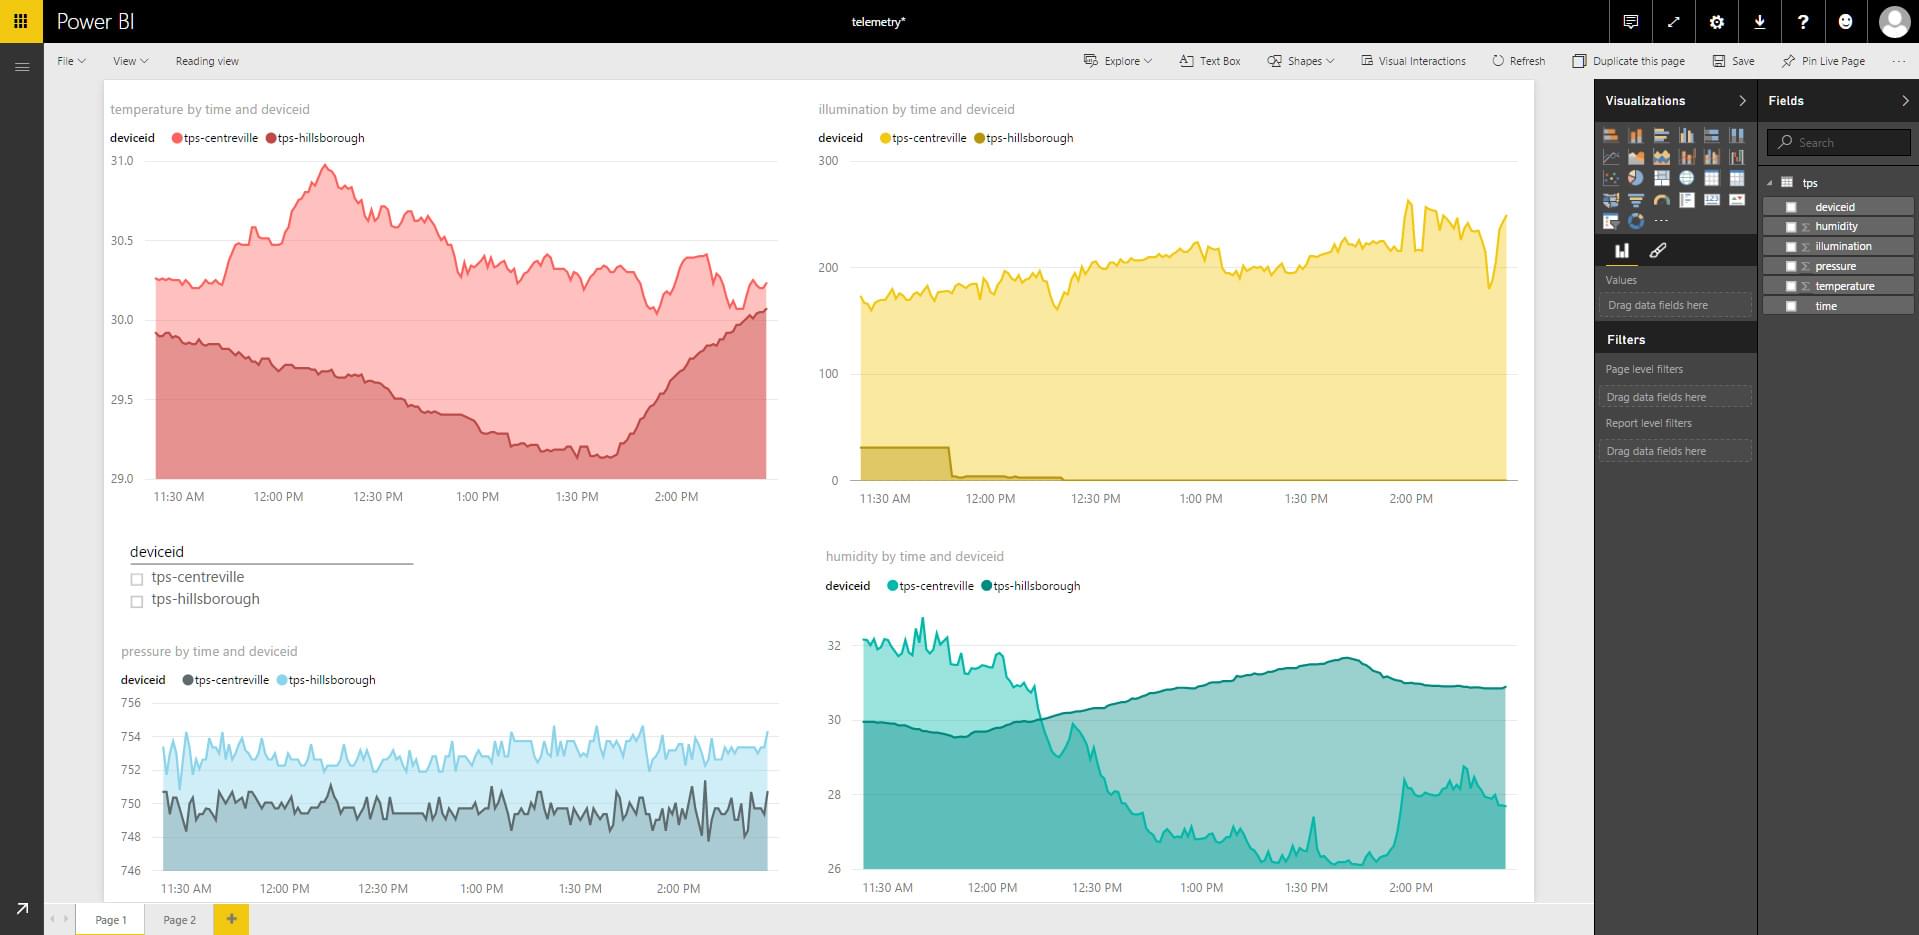
To complete this part of the tutorial, you'll need an active Microsoft Power BI subscription.
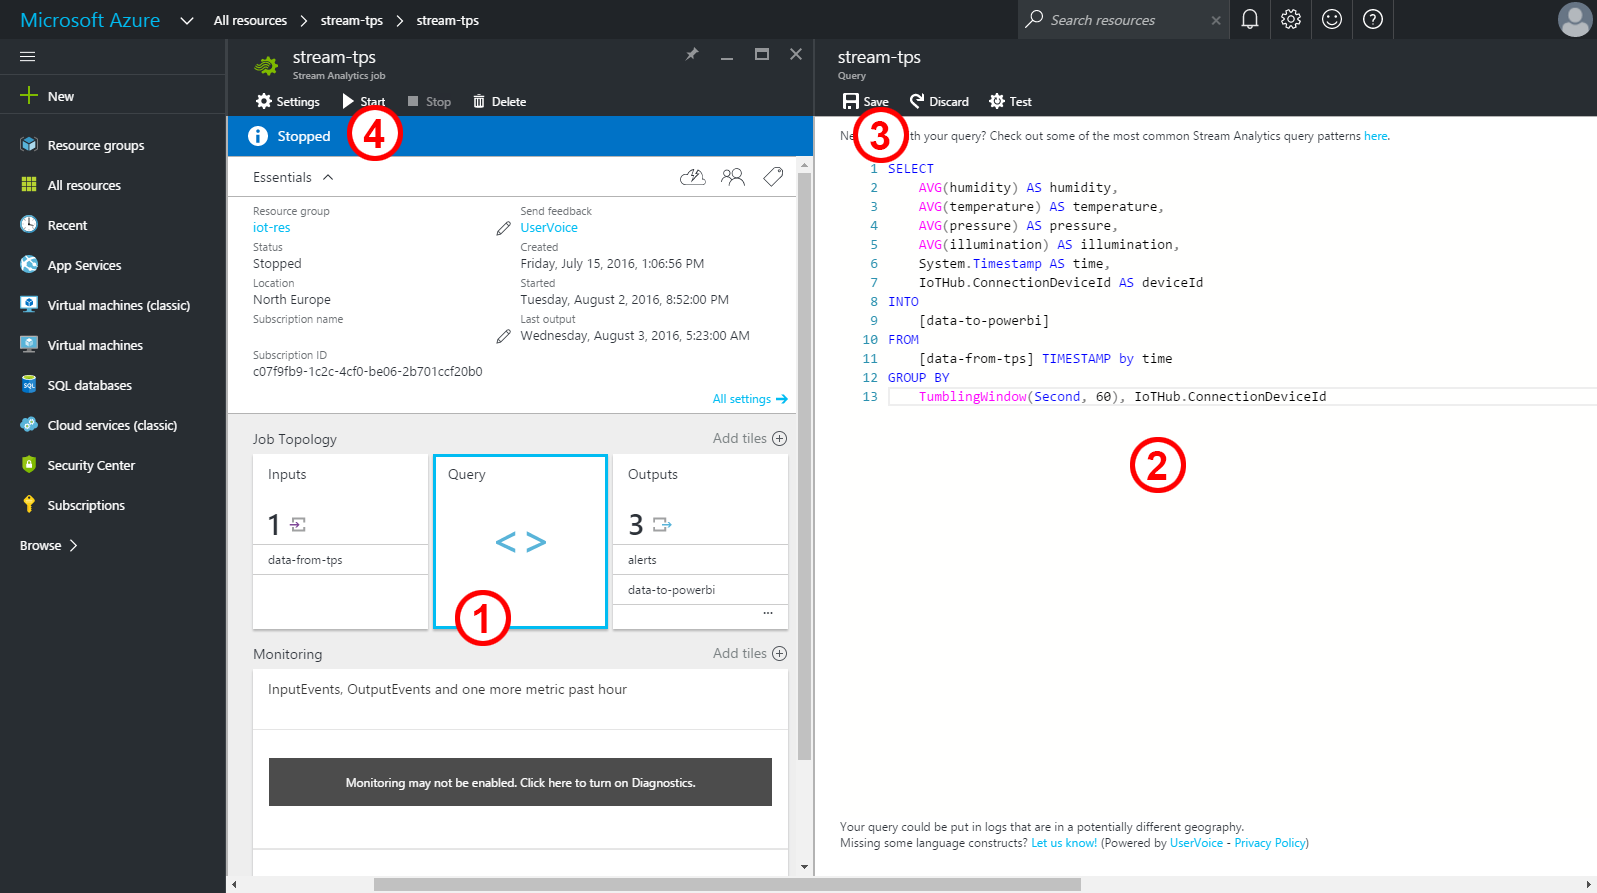
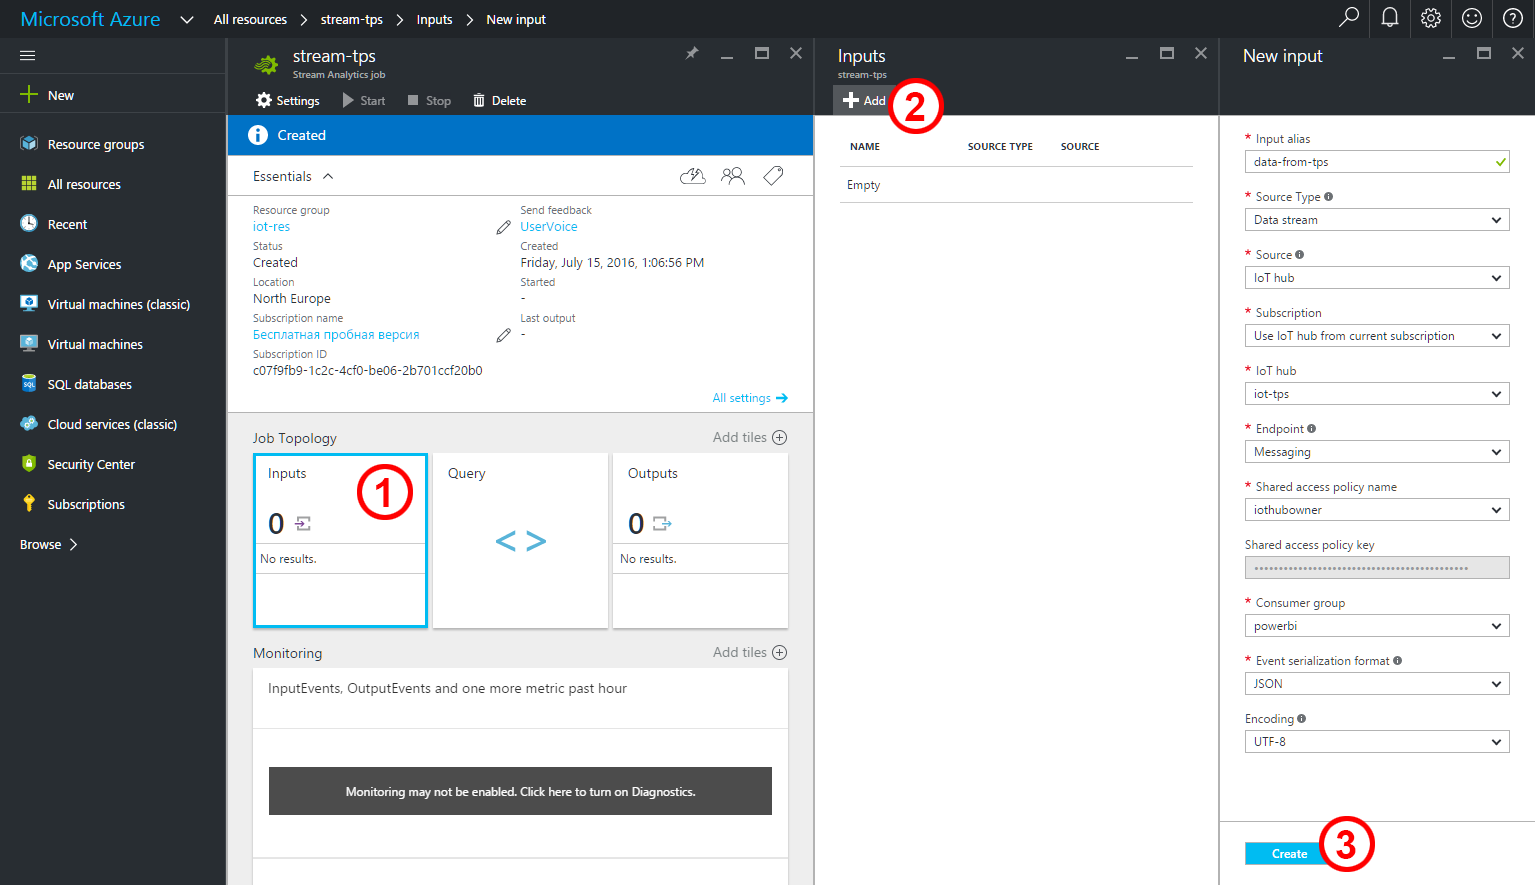
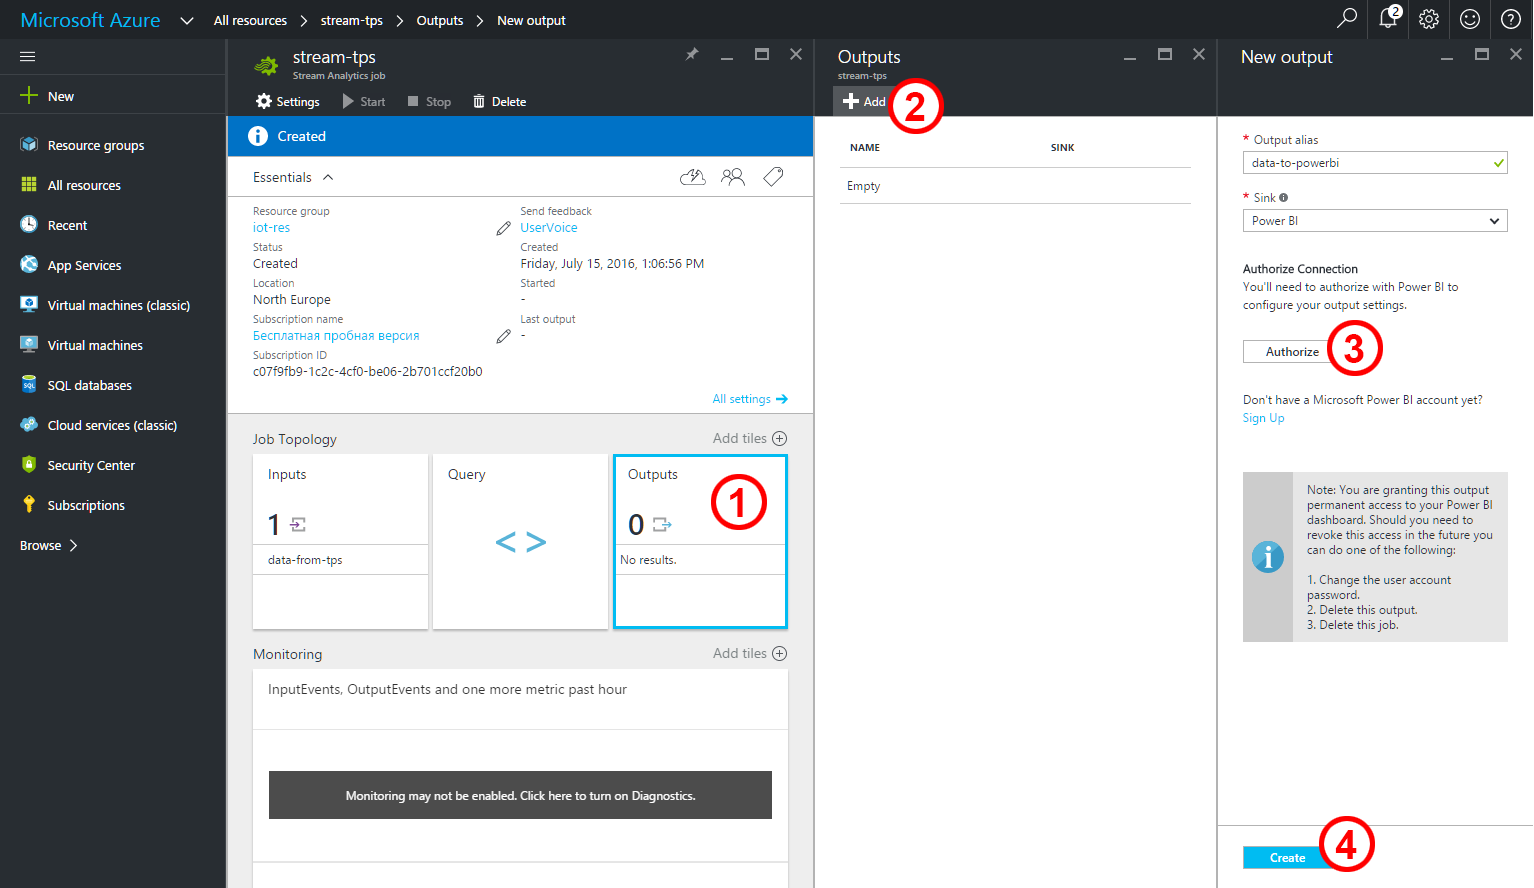
Before the information can be delivered to Power BI, it must be processed by the Azure Stream Analytics job.
Configure the input:
Configure the output:
Now it's time to enter the query:
SELECT
    AVG(humidity) AS humidity,
    AVG(temperature) AS temperature,
    AVG(pressure) AS pressure,
    AVG(illumination) AS illumination,
    System.Timestamp AS time,
    IoTHub.ConnectionDeviceId AS deviceId
INTO
    [data-to-powerbi]
FROM
    [data-from-tps] TIMESTAMP by time
GROUP BY
    TumblingWindow(Second, 60), IoTHub.ConnectionDeviceId
Stream Analytics Query Language is a subset of SQL. The complete language documentation can be found here. There is also a very useful set of examples.
The query above splits the timeline into 60-second slices and returns average values of humidity, temperature, pressure, and light level for each slice and each deviceId.
